Real Engineering Stories
The N+1 Query Problem That Slowed Down Our API
An N+1 feed query drove 1,000+ DB queries per request—API latency went from 100ms to 10+ seconds under peak load.
This is a story about how a seemingly simple feature addition—showing user avatars in a feed—caused our API to slow down from 100ms to 10+ seconds. It's also about why understanding database query patterns matters, and how we learned to profile queries before deploying.
Related reading on this site: For JOINs, indexes, and query plans in fundamentals form, see Query Optimization and Indexing. For connection pool exhaustion when query volume spikes, read The Cache Stampede That Took Down Our API. When resilience patterns fail to trip, compare The Circuit Breaker That Didn't Break.
Context
We were running a social media API with a feed endpoint that returned posts from users you follow. The system handled about 2M feed requests per day. Initially, the feed only showed post content and timestamps.
Original Architecture:
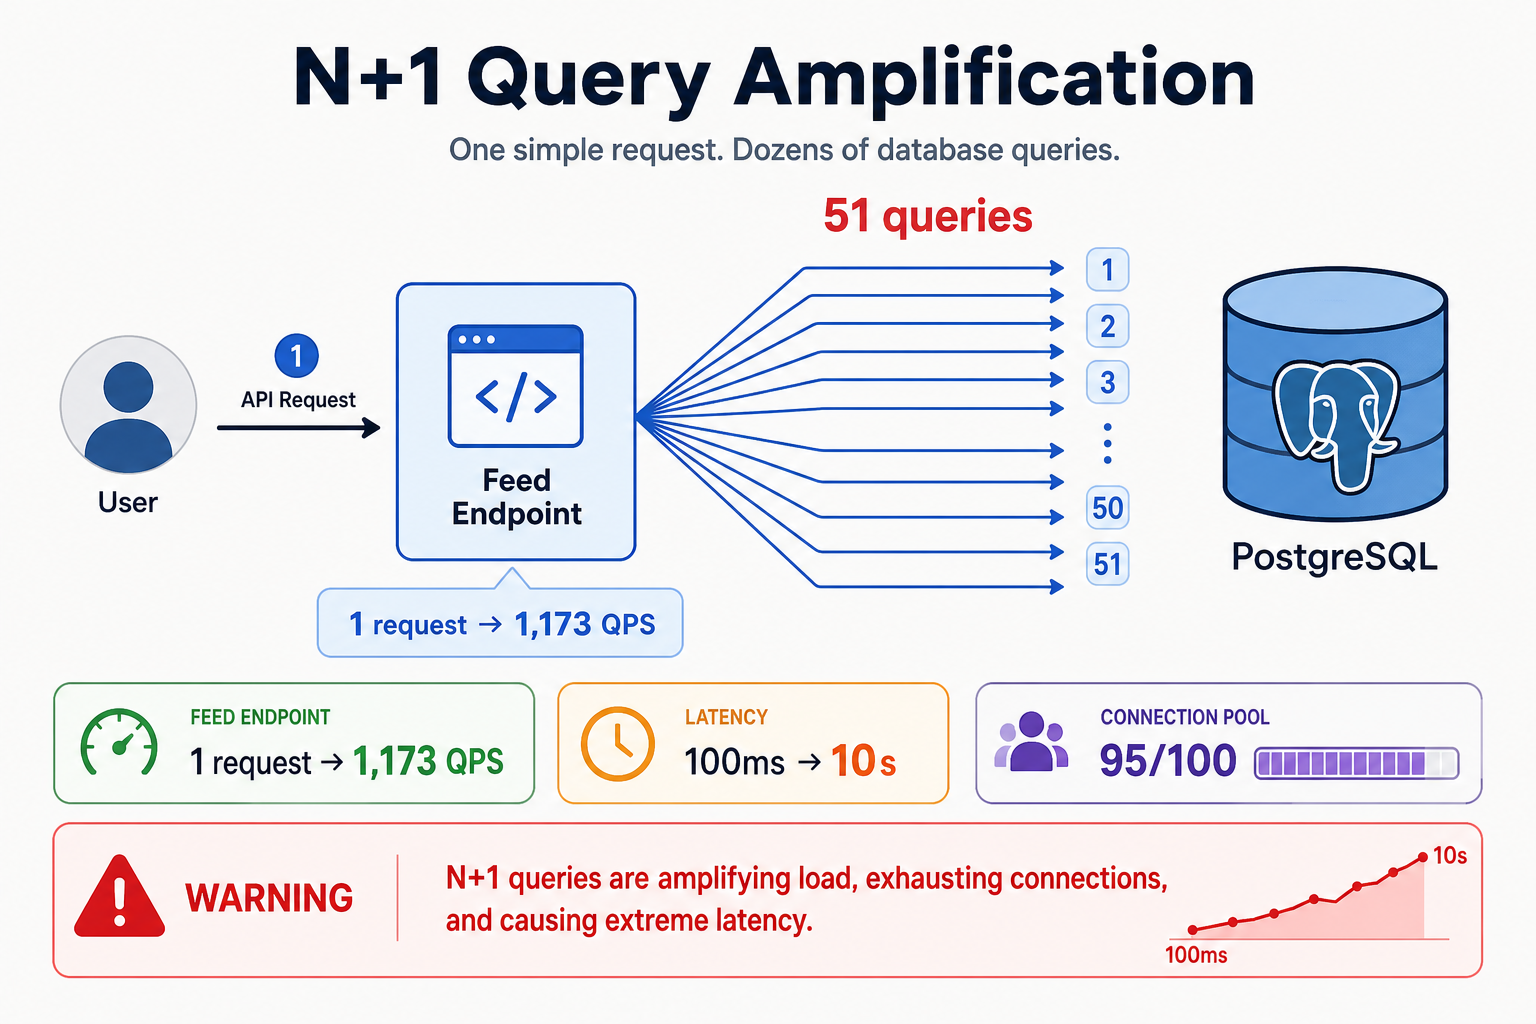
One feed request became 51 queries—at 23 RPS that was 1,173 database round-trips per second.
Technology Choices:
- API: Node.js with Express
- Database: PostgreSQL with connection pooling
- Cache: Redis for feed data
- ORM: Sequelize
Assumptions Made:
- Feed queries would be fast (indexed user_id and created_at)
- Database could handle feed request load
- Adding user avatars wouldn't significantly impact performance
The Incident
Symptoms
What We Saw:
- Response Time: p50 climbed 100ms → 500ms (Day 2) → 2s (Day 3) → 5s (Day 4) → 10s+ (Day 5)
- Database Queries: 1 → 51+ per feed request after avatar feature (50 posts × 1 user lookup each)
- Query Rate: ~23 feed RPS × 51 queries ≈ 1,173 queries/s on user table alone
- Database CPU: 20% → 90% by Day 5; connection pool wait time p99 > 2s
- Error Rate: 0.1% → 5% (gateway timeouts) as queries queued
- User Impact: ~100K feed requests failed or timed out over 48 hours of degradation
How We Detected It:
- Alert fired when feed p95 exceeded 2 seconds (Day 3)
pg_stat_statementsshowedSELECT * FROM users WHERE id = $1as top query by call count- ORM debug logging in staging reproduced 51 queries for one
GET /feedcall
Monitoring Gaps:
- No alert on queries per HTTP request (would have fired at 51 on Day 1)
- No query profiling gate in CI/CD for ORM changes
- Slow query log threshold (500ms) missed fast-but-frequent lookups
- No dashboard tying deploy markers to query-rate deltas
Root Cause Analysis
Primary Cause: N+1 query pattern in feed endpoint—one query for posts, then one user lookup per post in a loop.
How one avatar field multiplied database load:
The feed already fetched 50 posts in a single query. Adding avatars introduced a per-post User.findByPk inside a loop. Each request looked cheap in code review; multiplied by ~23 RPS it became 1,000+ queries per second against an indexed but chatty access pattern. CPU climbed gradually because the database kept up—until pool wait and lock contention pushed latency past client timeouts.
1 post query + 50 user queries per request × 23 RPS → ~1,173 user SELECTs/s → CPU 90% → pool wait → 10s responses
The Bug:
// BAD CODE (simplified)
async function getFeed(userId) {
  // 1 query: Get posts
  const posts = await Post.findAll({
    where: { userId: userId },
    limit: 50
  });

  // N queries: Get user for each post (N+1 problem!)
  for (const post of posts) {
    post.user = await User.findByPk(post.userId); // 50 queries!
  }

  return posts;
}
What Happened:
- Feed endpoint fetched 50 posts (1 query)
- For each post, it fetched the user to get avatar (50 queries)
- Total: 51 queries per feed request
- With 2M requests/day = ~23 requests/second
- That's 1,173 queries/second just for feeds
- Database couldn't handle the load
- Queries queued up, causing timeouts
Why It Was So Bad:
- No eager loading: Users weren't loaded with posts
- No query profiling: We didn't know about the N+1 problem
- Gradual degradation: Performance worsened over days, not immediately
- No query monitoring: We didn't track queries per request
Contributing Factors:
- ORM made it easy to write N+1 queries
- No code review checklist for database queries
- No query profiling in development
- Feature deployed without performance testing
Fix & Mitigation
Immediate Fix:
// FIXED CODE
async function getFeed(userId) {
  // 1 query: Get posts with users (eager loading)
  const posts = await Post.findAll({
    where: { userId: userId },
    include: [{ model: User, attributes: ['id', 'name', 'avatar'] }],
    limit: 50
  });

  // No additional queries needed!
  return posts;
}
Long-Term Improvements:
| Strategy | What it does | Best when |
|---|---|---|
| Eager loading / JOIN | Fetch posts + users in one query (include / JOIN) | Associations needed on every feed row—our hotfix |
Batch WHERE id IN (...) | Second query for all distinct user IDs, map in memory | Many posts, few unique authors; avoids wide JOIN |
| Denormalize avatar on post | Store avatar_url on post row at write time | Read-heavy feeds; avatar changes infrequent |
| DataLoader / request-scoped cache | Dedupe user fetches within one HTTP request | GraphQL or nested resolvers with shared loader |
-
Query Optimization:
- Added eager loading for all associations
- Added query profiling in development
- Added query count limits per request
-
Monitoring & Alerting:
- Added alert for query count per request (alert if > 10)
- Added slow query log analysis
- Added database query rate monitoring
-
Code Review Process:
- Added checklist for database queries (eager loading, indexes, N+1)
- Added query profiling to code review
- Added performance testing for database-heavy endpoints
-
Process Improvements:
- Required query profiling before deploying database changes
- Added performance benchmarks for critical endpoints
- Created runbook for query optimization
Architecture After Fix
Key Changes:
- Eager loading for all database associations
- Query profiling in development and staging
- Query count monitoring and alerting
- Performance testing in CI/CD
Key Lessons
-
N+1 queries are silent killers: They don't cause immediate failures, but they will slow down your API. Always use eager loading.
-
Profile queries before deploying: Know how many queries your endpoints execute. Set limits and alerts.
-
Monitor query patterns: Track queries per request, not just total queries. N+1 problems show up as high query counts.
-
ORMs make it easy to write bad queries: ORMs are convenient, but they can hide performance problems. Always check the generated SQL.
-
Performance testing matters: Test database-heavy endpoints under load before deploying.
Interview Takeaways
Common Questions:
- "What is the N+1 query problem?"
- "How do you optimize database queries?"
- "How do you prevent N+1 queries?"
What Interviewers Are Looking For:
- Understanding of N+1 query problem
- Knowledge of eager loading and query optimization
- Experience with database performance issues
- Awareness of ORM pitfalls
What a Senior Engineer Would Do Differently
From the Start:
- Use eager loading: Always load associations in the initial query
- Profile queries: Know how many queries each endpoint executes
- Monitor query patterns: Alert on high query counts per request
- Performance test: Test database-heavy endpoints under load
- Code review for queries: Add query optimization to code review checklist
The Real Lesson: ORMs make it easy to write code, but they also make it easy to write slow code. Always check the generated SQL and profile your queries.
How I'd answer in interviews
"We added user avatars to a feed that already loaded fifty posts in one query, then looped User.findByPk for each post—fifty-one queries per request. At twenty-three feed requests per second that was over a thousand user lookups per second, CPU hit ninety percent, and p50 latency went from a hundred milliseconds to ten seconds before anyone tied it to the deploy. I'd fix it with eager loading or a batched WHERE IN, alert on queries-per-request in CI, and require ORM SQL logging for any endpoint that touches associations. For read-heavy feeds I'd also consider denormalizing avatar URLs onto the post row."
Related reading on this site
- Query Optimization — JOINs, plans, and eliminating chatty access patterns.
- Indexing — when lookups are fast individually but deadly at N+1 scale.
- Connection Pooling — pool wait and saturation after query volume spikes.
- The Cache Stampede That Took Down Our API — another incident where database load snowballed from an innocent change.
- Caching Strategies — when to cache feed fragments vs fixing the query pattern at the source.
FAQs
Q: What is the N+1 query problem?
A: The N+1 query problem occurs when you fetch N records, then make N additional queries to fetch related data. For example, fetching 50 posts, then making 50 queries to fetch each post's user. This should be done in 1 query with eager loading.
Q: What's the difference between N+1 queries and one slow query?
A: N+1 is many fast queries (often <5ms each) that add up to high QPS and pool pressure—our 51 lookups per request looked fine in isolation. One slow query is a single expensive plan (missing index, full scan). Both hurt latency; N+1 is sneakier because each query passes the slow-query log threshold. Fix N+1 with JOINs or batching; fix slow queries with indexes and plan tuning.
Q: How do you prevent N+1 queries?
A: Use eager loading to fetch associations in the initial query. In Sequelize, use include. In raw SQL, use JOINs. Always load related data in one query, not in a loop.
Q: How do you detect N+1 queries?
A: Monitor query count per request. If one request executes 100+ queries, you likely have an N+1 problem. Use query profiling tools to identify the pattern.
Q: Are ORMs bad for performance?
A: ORMs aren't inherently bad, but they can hide performance problems. Always check the generated SQL and profile queries. Use eager loading and avoid lazy loading in loops.
Q: How do you optimize slow queries?
A: Use indexes, eager loading, query caching, and pagination. Profile queries to identify bottlenecks. Consider denormalization for read-heavy workloads.
Q: Should you always use eager loading?
A: Not always. Eager loading is good for frequently accessed associations. For rarely accessed data, lazy loading might be fine. The key is to avoid loading in loops.
Q: How do you test query performance?
A: Use query profiling tools, load testing, and database monitoring. Set up alerts for slow queries and high query counts. Test in staging with production-like data volumes.
Keep exploring
Real engineering stories work best when combined with practice. Explore more stories or apply what you've learned in our system design practice platform.