Real Engineering Stories
The Memory Leak That Caused Gradual Degradation
An unbounded in-memory Map grew for 21 days until pods OOM'd—50K queue depth and 200K notifications delayed for hours.
This is a story about a silent failure: an unbounded in-memory Map in our notification workers grew for twenty-one days before anyone treated it as an emergency. Memory crept from 200MB to 1.2GB per pod, Kubernetes OOM-killed every worker, and 50K messages backed up in RabbitMQ. Sudden outages get pages; gradual leaks get shrugged emojis until the cliff.
Related reading on this site: For queue-backed workers and delivery patterns, see Message Queues. For trend-based alerts and resource golden signals, use Monitoring & Observability. For a burst outage after backlog drain (another queue failure mode), read The Message Queue Lag That Overwhelmed Our Order Processing. For bounded in-memory data at scale, see Caching Strategies.
Context
We ran a notification microservice—email, SMS, and push—processing about 1M notifications per day. Three worker pods on Kubernetes (HPA 1–10) pulled jobs from RabbitMQ and called provider APIs.
Original Architecture:
Stateless workers in theory; one unbounded Map made them stateful in memory. Auto-scaling added pods under CPU load but didn't fix per-pod heap growth.
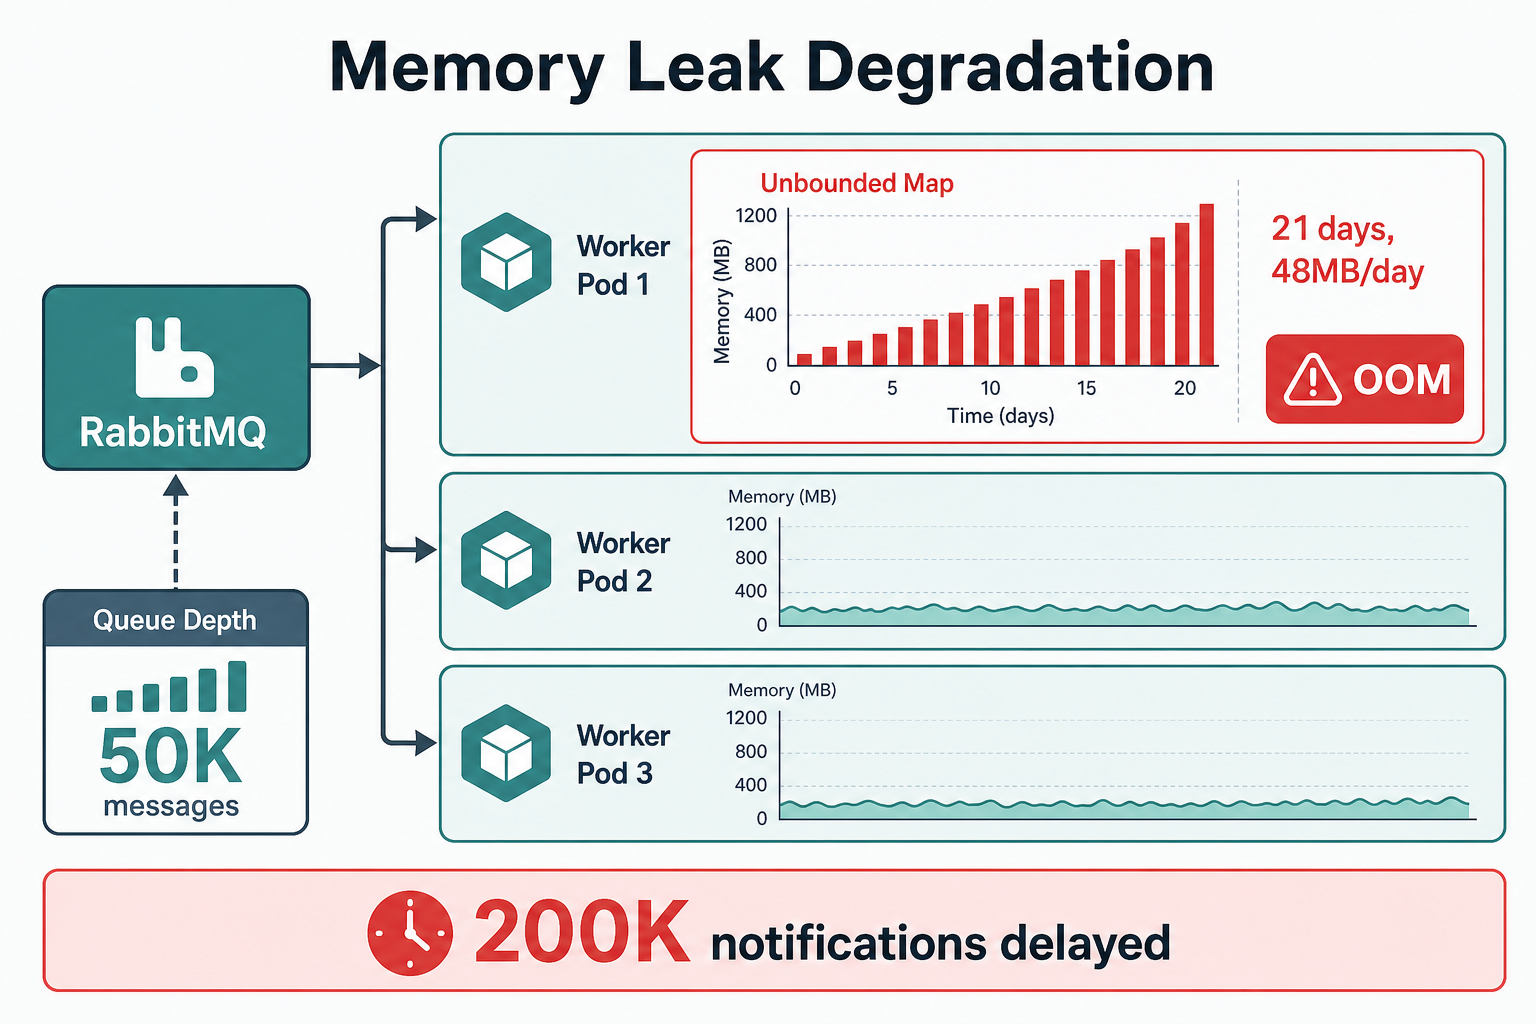
A dedupe Map grew ~48 MB/day per pod—HPA added replicas but every pod eventually OOM'd.
Technology Choices:
- Workers: Node.js (3 pods baseline, HPA on CPU)
- Queue: RabbitMQ (~1M msgs/day)
- Database: PostgreSQL (delivery status)
- Orchestration: Kubernetes (1.5GB memory limit per pod)
Assumptions Made:
- Memory usage would plateau after warm-up
- Auto-scaling would handle traffic spikes
- Pod restarts would mask leaks (they didn't—we kept re-leaking)
- Absolute memory alerts were enough (no trend analysis)
The Incident
Symptoms
What We Saw:
- Memory Usage: Linear climb 200MB → 1.2GB over 21 days (~48MB/day)
- Pod Restarts: 0 until Day 21; then 12 OOM restarts in 30 minutes
- Queue Depth: 0 → 50K messages during outage window
- Processing Rate: 1,000 notifications/min → 200/min during restart storm
- GC Pause Time: p99 GC rose from 20ms to 400ms in final 48 hours
- User Impact: ~200K notifications delayed 2–4 hours
How We Detected It:
- Static threshold alert on Day 14 (800MB)—ticket closed without trend analysis
- OOMKilled events and
CrashLoopBackOffon Day 21 - Queue depth alert when backlog exceeded 10K
Monitoring Gaps:
- No memory slope alert (e.g., >10% growth/day)
- No correlation between deploy date and memory baseline shift
- No periodic heap profiling in production
- No alert on pod restart frequency or OOMKilled reason
Root Cause Analysis
Primary Cause: Unbounded in-memory cache—a Map that stored every processed notification forever.
How a "cache" became a leak:
The worker stored each notification in a Map keyed by ID "for deduplication." There was no TTL, no max size, and no cleanup on success. At ~1M notifications/day across three pods, each pod accumulated hundreds of thousands of entries over weeks. Every entry held the full notification object (payload, metadata, provider responses). Heap grew linearly until it hit the 1.5GB cgroup limit; Kubernetes killed the pod; the replacement pod started leaking again from zero—but the queue replayed work and memory climbed fast.
Unbounded Map → linear heap growth → GC pressure → OOMKill → restart storm → queue backlog
The Bug:
// BAD CODE (simplified)
const notificationCache = new Map();

async function processNotification(notification) {
  notificationCache.set(notification.id, notification);
  await sendNotification(notification);
  // Never deleted — grows ~1M entries/month per pod
}
What Happened:
- Each notification inserted into
Mapon process - No eviction—entries lived for pod lifetime (up to 21 days)
- ~1M+ entries per pod; ~1–2KB per entry → >1GB heap
- GC couldn't reclaim; pause times spiked
- OOMKill → all pods cycling → consumers stalled → 50K queue backlog
Why It Wasn't Caught:
- Growth was linear and slow—easy to normalize
- Alerts on absolute MB, not derivative (MB/day)
- Code review missed unbounded structure
- CI tests ran minutes, not days—no leak soak test
Contributing Factors:
- Generous 1.5GB limit delayed failure (masked urgency)
- Assumed Redis or DB should dedupe—not documented
- No memory profiling in deploy pipeline
- HPA scaled on CPU; memory not a scaling signal
Fix & Mitigation
Immediate Fix:
// FIXED CODE (simplified)
const notificationCache = new Map();
const MAX_CACHE_SIZE = 1000;
const CACHE_TTL_MS = 5 * 60 * 1000;

async function processNotification(notification) {
  if (notificationCache.size < MAX_CACHE_SIZE) {
    notificationCache.set(notification.id, {
      data: notification,
      timestamp: Date.now(),
    });
  }
  await sendNotification(notification);
  cleanupCache();
}

function cleanupCache() {
  const now = Date.now();
  for (const [id, entry] of notificationCache.entries()) {
    if (now - entry.timestamp > CACHE_TTL_MS) {
      notificationCache.delete(id);
    }
  }
  while (notificationCache.size > MAX_CACHE_SIZE) {
    const oldest = notificationCache.keys().next().value;
    notificationCache.delete(oldest);
  }
}
Long-Term Improvements:
| Strategy | What it does | Best when |
|---|---|---|
| Bounded cache + TTL | Cap entries and time-to-live | In-process dedupe windows |
| External dedupe store | Redis SET with TTL | Cross-pod idempotency |
| Memory slope alerts | Page on >10% growth/day | Any long-lived worker |
| Lower pod memory limits | Fail fast before multi-week drift | Catch leaks in days not weeks |
| Periodic heap profiles | Weekly sampled dumps in prod | Node/Java services |
-
Bounded Memory:
- Replaced
Mapwith Redis dedupe keys (24h TTL) for cross-pod idempotency - In-process LRU max 1,000 entries, 5-minute TTL
- Aligned with caching strategies—never unbounded
- Replaced
-
Memory Leak Detection:
- Alert if pod memory increases >10% over 24h (slope)
- Weekly automated heap snapshot comparison
- Dashboard: memory vs. queue depth vs. deploy markers
-
Kubernetes Hardening:
- Memory limit reduced 1.5GB → 512MB (right-sized after fix)
- HPA metrics include memory utilization
- OOMKilled → immediate P1 alert with pod name and reason
-
Process Improvements:
- Code review checklist: bounded structures, listener cleanup, closure refs
- 24-hour leak soak test in CI for worker services
- Runbook for gradual memory incidents
Architecture After Fix
Key Changes:
- Redis-backed idempotency with TTL (cross-pod)
- Bounded in-process LRU cache
- Memory slope and OOMKilled alerting
- Lower, right-sized memory limits
- Weekly heap profiling in production
Key Lessons
-
Gradual leaks evade absolute thresholds: Monitor trends (MB/day), not just "under limit."
-
Unbounded in-process caches are leaks waiting to happen: Always set max size and TTL—or use Redis.
-
Generous limits hide urgency: 1.5GB let the leak run for three weeks; tighter limits fail faster.
-
OOMKill restart storms queue backlog: Memory issues become throughput incidents—watch queue depth together.
-
Profile in production: Weekly heap snapshots catch what unit tests miss.
-
Dedupe belongs in shared storage: Per-pod
Mapdoesn't survive restarts and doesn't dedupe across replicas. -
Code review for memory: Checklist item for Maps, arrays, event listeners, and closures.
Interview Takeaways
Common Questions:
- "How do you detect memory leaks in production?"
- "What causes memory leaks in Node.js?"
- "How do you design workers with bounded memory?"
What Interviewers Are Looking For:
- Trend-based alerting vs. static thresholds
- Bounded caches, TTLs, external dedupe stores
- OOMKill / Kubernetes failure modes
- Connection to queue backlog and user-visible delay
- Profiling and soak testing strategies
What a Senior Engineer Would Do Differently
From the Start:
- Never ship unbounded in-memory structures in long-running workers
- Use Redis (or DB) for dedupe with explicit TTL
- Alert on memory slope, pod restart rate, and OOMKilled events
- Right-size memory limits to force early detection
- Add leak soak tests in CI (24h synthetic run on merge to main)
- Dashboard memory with deploy annotations to spot regressions quickly
The Real Lesson: Memory leaks are slow-motion outages. If you only watch absolutes, you'll explain away the cliff until you're in it.
How I'd answer in interviews
"Our notification workers kept every processed message in an unbounded in-memory Map for deduplication. Over twenty-one days heap grew from 200MB to 1.2GB per pod until Kubernetes OOM-killed all replicas, queue depth hit fifty thousand, and two hundred thousand notifications were delayed. I'd use Redis with TTL for idempotency, bound any in-process cache, alert on memory slope and OOMKilled, lower pod limits to fail fast, and run leak soak tests in CI. The interview point: gradual resource leaks need trend alerts—absolute thresholds normalize slow death."
Related reading on this site
- Message Queues — consumer patterns, acks, and backlog behavior when workers die.
- Monitoring & Observability — slope alerts, golden signals, and OOM/runbook design.
- Caching Strategies — TTL, eviction, and why unbounded "caches" are dangerous.
- The Message Queue Lag That Overwhelmed Our Order Processing — when queue backlog causes a second incident on drain.
- The Cache Stampede That Took Down Our API — another unbounded-growth pattern with different symptoms.
FAQs
Q: What causes memory leaks in production workers?
A: Unbounded Maps/arrays, missing cleanup, event listeners not removed, closures holding large objects, and "temporary" caches without TTL. In our case, a dedupe Map never evicted entries.
Q: How do you detect memory leaks before OOM?
A: Alert on memory growth rate (e.g., >10%/day), rising GC pause times, and pod restart frequency. Compare heap snapshots week over week—not just current MB.
Q: Why are gradual leaks harder than sudden failures?
A: They stay under static limits for weeks. Teams normalize slow growth. Trend alerts and deploy-correlated dashboards catch them earlier.
Q: Should deduplication use in-memory or Redis?
A: For multi-pod workers, use Redis (or DB) with TTL so dedupe is shared and bounded. In-process LRU is OK for short windows only.
Q: Should you set lower or higher pod memory limits?
A: Right-size after profiling. Too high masks leaks for weeks; too low causes false OOMs. After our fix, 512MB was correct for ~250MB steady state.
Q: What's the difference between a memory leak and high steady memory?
A: Leak = monotonic growth that doesn't drop after GC. Steady high = stable but maybe inefficient. Leaks end in OOM; steady high might be acceptable if bounded.
Q: How does this relate to queue backpressure?
A: OOM kills stop consumption—queue depth grows. When workers return, draining backlog can spike downstream load. See message queue backpressure for catch-up bursts.
Keep exploring
Real engineering stories work best when combined with practice. Explore more stories or apply what you've learned in our system design practice platform.