System design interview guide
Logging System Design
It is 2am during an incident. Services produce hundreds of terabytes of logs per day, one bad deployment turns on noisy debug lines, and on-call needs to tail fresh logs and search the last few days without a rogue query killing the search cluster. The system must ingest reliably, protect applications from logging backpressure, redact sensitive data, and keep cost under control.
Problem statement
Design a centralized logging platform that collects logs from many services, buffers spikes, parses and redacts data, stores recent logs for fast search, moves old logs to cheaper retention tiers, and protects applications when the logging pipeline is slow. The main interview work is deciding what is durable, what can be dropped, how queries stay bounded, and how cost is controlled.
Introduction
When the product breaks at 2am, everyone opens the logging tool. If that tool is slow, missing lines, or too expensive to search, the incident gets harder—not easier. Logging can also hurt the app itself if writers block, disks fill, or a debug storm eats the network.
The journey is simple to say: emit a line → buffer so spikes do not kill the app → search recent lines quickly (and store older ones cheaper).
Weak answers name ELK or Kafka first. Strong answers decide the policy first: debug may drop under pressure; audit must alert if it cannot be kept. Brands come after that story.
This page is in the system design interview guides hub.
If this is your first time, go to Board path below—come back after one mock.
Board path (first read, ~10 min)
Start here if you have never designed a logging platform. Finish this section, then stop and try a mock. Kafka/ELK brands, capacity, and index tuning live in After one mock.
What problem are we solving?
Many services produce log lines. On-call needs to ask:
“What happened in the last few minutes for this service—and can I trust that the important lines are still there?”
You must collect lines without freezing the product, keep recent ones searchable, and have a clear rule when the pipe fills up.
What to write on the board (start simple)
Write these four lines. Plain English is enough for a first mock.
- Emit — App writes structured lines (who, when, level, message). Prefer not to block the user request forever on logging.
- Buffer — A local or regional cushion absorbs spikes so a slow pipe does not take down the app.
- Process + store — Parse, remove sensitive fields, keep recent data for fast search, move old data to cheaper storage.
- Search with bounds — Queries need a time range and size limits so one wild search cannot melt the platform.
That’s your whole first board. Queue and search product names come after this mock.
Debug may drop vs audit must alert (before brands)
Not every line has the same value. Say the policy out loud before you name Kafka or Elasticsearch:
| Class | Under pressure | If we cannot keep it |
|---|---|---|
| Debug / noisy | May sample or drop | Prefer keep the app up |
| Audit / security | Stronger keep promise | Must alert—do not lose silently |
One pipe with one loss rule fails the first real incident.
Clarifying questions (classes, query, loss, PII)
You: “Which log kinds are in scope—debug, audit, security, access?”
Interviewer: “All of them, but class-specific policy must be clear.”
Checkpoint: Write two policies on the board: debug may drop; audit must alert.
You: “What query experience do users need?”
Interviewer: “Fast search for recent logs, slower access for old logs, and live tail during incidents.”
Checkpoint: Recent = hot search. Old = cheaper/slower. Do not promise instant search over years.
You: “Can logging backpressure affect application requests?”
Interviewer: “Apps should keep running, but audit loss must be visible.”
Checkpoint: Buffer + class-specific overflow. Drop debug first; never silent-drop audit.
You: “Do we need PII redaction and tenant isolation?”
Interviewer: “Yes.”
Checkpoint: Redact before broad search. One team must not see another team’s logs.
You: “What scale?”
Interviewer: “Hundreds of terabytes per day, with incident spikes.”
Checkpoint: Quotas and retention are part of the design—not “add more nodes later.” Park Kafka/ELK names for After one mock.
What you can say out loud (next to the board)
- Path: “One line: emit → buffer → process → recent search + cheap old storage.”
- Classes: “Debug can drop under pressure; audit must stay durable or page someone.”
- App safety: “I won’t let a full logging pipe freeze checkout—I’ll buffer and shed debug first.”
- Search: “Queries need time bounds and size caps so one search can’t take down logging.”
First-pass: what should stick
- Emit → buffer → search — Buffer protects the app; search is for recent data with bounds.
- Class policy before brands — Debug may drop; audit must alert. Then name the queue/index products.
- Unbounded search is a design bug — Time range + quotas are required, not nice-to-haves.
End of first pass
⏸ End of first pass — stop scrolling.
You have enough for the requirements stage. Practice that now. Do not continue into Kafka, Elasticsearch, or capacity until you’ve done a short requirements mock.
→ Practice requirements only (~5–10 minutes)
Ready for depth? Only then open After one mock.
After one mock
Return to Board path if this is your first read.
Everything below is for after one mock—or when the interviewer pushes on durable queues, hot indexes, capacity, and production failure modes.
Depth map (read in order):
- How to approach (full clarifying + pacing)
- Capacity (bytes, partitions, retention)
- High-level architecture (agent → buffer → index)
- Detailed design (one log line end to end)
- Backpressure, cost, and interview tips
How to approach
Clarifying questions for the requirements stage live in the Board path. After that mock, deepen with capacity, queue/index brands, and one log-line walkthrough.
Follow one log line from the application to the search result. Then follow the failure path when ingestion slows. This keeps the design honest because every box has to answer the same questions: does it buffer, does it drop, does it block, and does it alert?
Clarifying questions (say these in the room)
You: "What kinds of logs are in scope: debug application logs, audit logs, security logs, access logs, or all of them?"
Interviewer: "Include all of them, but make class-specific policy clear."
That answer means you should not use one durability and sampling rule for everything. Debug can be sampled. Audit may require no sampling and stronger retention.
You: "What query experience do users need?"
Interviewer: "Fast search for recent logs, slower access for old logs, and live tail during incidents."
That answer leads to hot storage for recent data and cold storage for older data. It also tells you not to promise sub-second interactive search over years of logs.
You: "Can logging backpressure affect application requests?"
Interviewer: "Applications should keep running, but audit loss must be visible."
That answer forces a loss policy. Agents may drop debug first or throttle noisy producers, but they should not silently drop audit lines without alerts.
You: "Do we need PII redaction and tenant isolation?"
Interviewer: "Yes. Users from one team or tenant should not see another team's logs, and secrets should not be broadly searchable."
That answer puts redaction and RBAC in the main path before indexing, not as a batch cleanup after data spreads.
You: "What scale should we design for?"
Interviewer: "Hundreds of terabytes per day, with spikes during incidents."
That answer makes cost and partitions central. You need quotas, lifecycle policies, and query cost limits, not only more index nodes.
Minute pacing
| Minute | What to cover | Why it matters |
|---|---|---|
| 0-5 | Clarify log classes, query needs, retention, PII, and loss policy | These choices decide durability, sampling, and access control |
| 5-10 | Capacity sketch: events per second, bytes per day, hot retention, query shape | Logging design is dominated by volume and retention cost |
| 10-18 | Draw agent to durable buffer to processors to hot and cold stores | This establishes the ingestion spine |
| 18-26 | Walk one log line through parsing, redaction, indexing, and search | This proves the path works end to end |
| 26-36 | Deep dive into backpressure, hot partitions, cardinality, and query limits | These are the common production failures |
| 36-45 | Failure, observability, security, cost, scenes, and interview tips | This shows you can operate the platform |
In the room (fuller opening after the board): “Emit → buffer → process → recent search + cheap old storage. Debug may drop under pressure; audit must stay durable or alert. Search needs time bounds and quotas so one query can’t melt the platform.”
Out of scope (and why you park these)
Full metrics and tracing platform. Logs should connect to metrics and traces through fields like trace_id, but designing metrics storage and distributed tracing in depth would be a separate interview.
Every possible query language feature. A safe subset of KQL or Lucene-style search is enough. Regex over petabytes, arbitrary joins, and unbounded scans should be parked or moved to async export.
A complete SIEM product. Security analytics can consume audit and security logs, but correlation rules and threat detection pipelines are extra scope unless asked.
Manual dashboard design. Dashboards matter, but the system design is about ingestion, storage, query, access control, and operations.
Perfect no-loss for all logs. You can make audit very durable, but promising zero loss for all debug logs under any failure is usually too expensive and can hurt the application.
Capacity estimation
The capacity story is mostly bytes, partitions, and query shape. A small number of services can produce most of the volume, especially when a bad deploy turns on noisy logging.
| Axis | Interview-scale number | What it means for design |
|---|---|---|
| Ingest rate | Millions of events per second | Agents, collectors, and queues must batch and partition work |
| Daily volume | Hundreds of TB to PB per day | Retention and compression decide monthly cost |
| Hot retention | 3 to 30 days | Hot search index must be sized for recent incident debugging |
| Cold retention | Months or years | Object storage and columnar formats are cheaper but slower |
| Query latency | Seconds for recent bounded search | Require time ranges, limits, and query planning |
| Cardinality | Thousands of services and many fields | Schema control prevents mapping and index explosions |
| Burst behavior | Incidents and bad deploys multiply logs | Quotas and backpressure protect the platform and applications |
These numbers imply that not all data should be indexed forever. Recent logs can live in expensive hot search. Older logs should move to cheaper object storage. Debug and audit need different policies because their value and loss tolerance are different.
High-level architecture
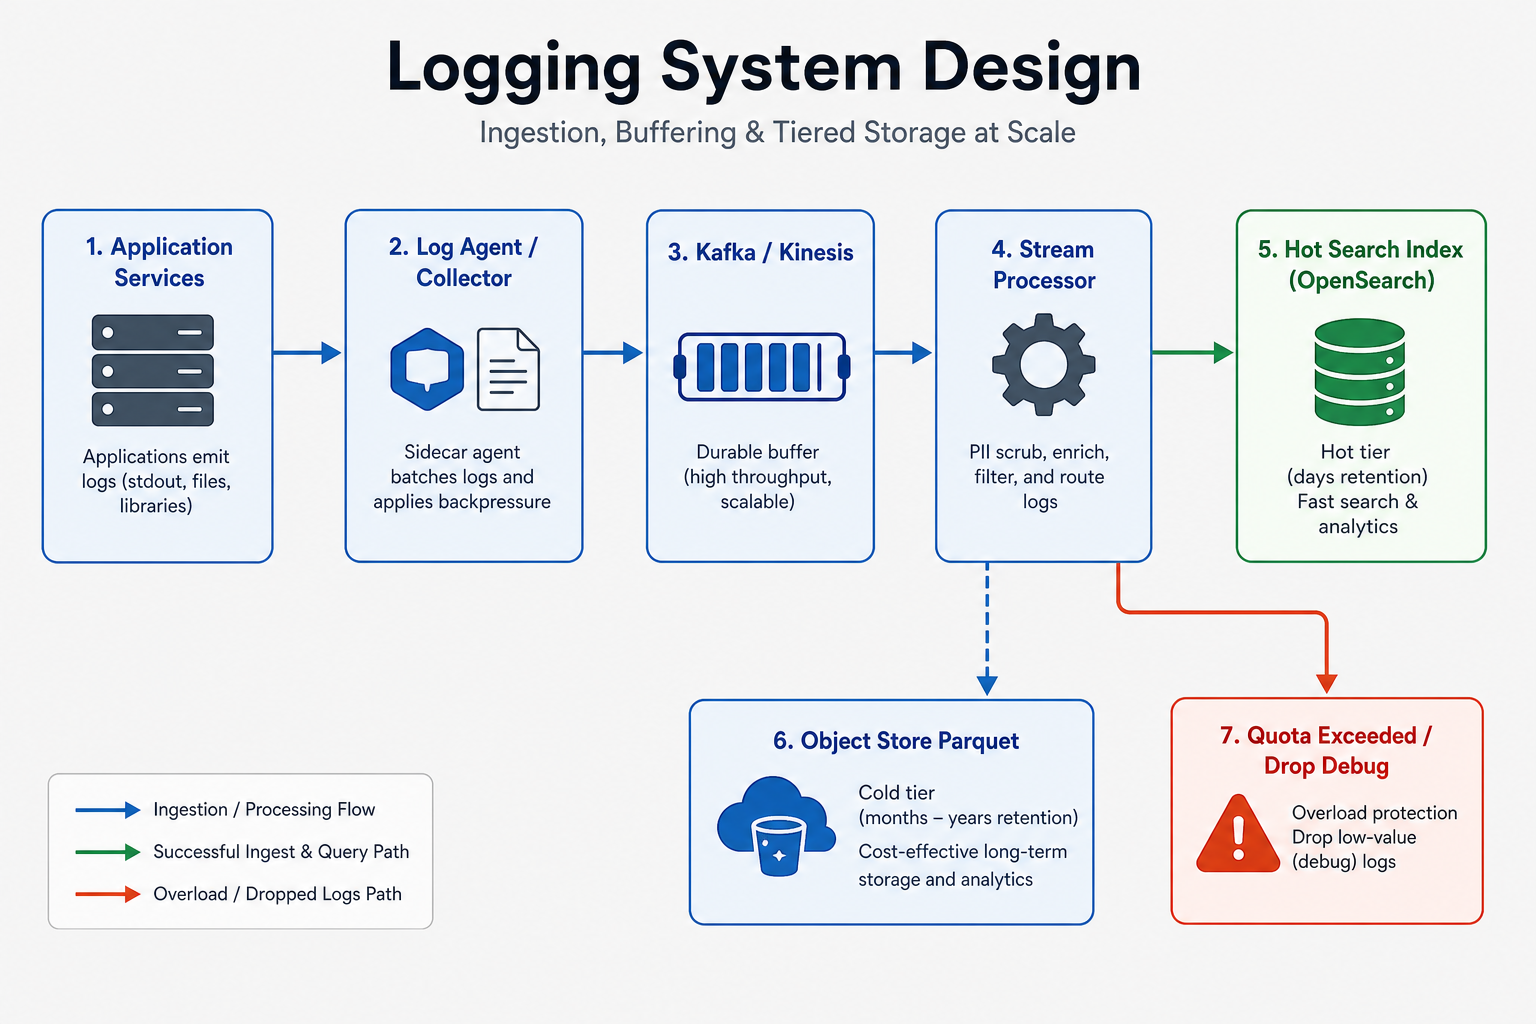
The architecture has five layers: collection, durable buffer, processing, storage, and query.
[ App containers / VMs ]
        |
        v
[ Agent: tail, batch, local disk spool, quotas ]
        |
        v
[ Regional collector ]
        |
        v
[ Kafka / Kinesis: durable buffer, partitioned by tenant/service/class ]
        |
        +--> [ Stream processors: parse, enrich, redact PII, route ]
                  |
                  +--> [ Hot search index: recent days, interactive query ]
                  |
                  +--> [ Object storage: raw/Parquet, long retention ]
                  |
                  +--> [ Metrics / alert rules from selected logs ]

[ User ] --> [ Query API + RBAC + cost planner ] --> hot search or async cold job
Agents run close to applications. They read stdout, files, or an agent socket, batch lines, compress payloads, and spool to local disk if upstream is slow. Regional collectors receive agent batches and write to the durable queue. Stream processors parse and enrich logs, redact sensitive fields, route data by tenant and class, and bulk-write to storage.
Hot storage is optimized for recent interactive search. It might be OpenSearch, Elasticsearch, ClickHouse, or another system, but the design should talk about behavior rather than vendor. Cold storage is optimized for cheap retention and slower scans, often object storage with compressed columnar files.
The query API enforces authentication, tenant authorization, time bounds, row caps, byte caps, and timeouts. It routes recent bounded queries to the hot tier and large old queries to async export or a cold analytics engine.
Who owns what:
- Agent owns local collection, buffering, compression, first-line sampling, and producer backpressure.
- Collector owns regional ingress, authentication from agents, and queue writes.
- Queue owns durable buffering, replay, and decoupling producers from indexers.
- Stream processors own parsing, enrichment, redaction, routing, and derived metrics.
- Indexers own bulk writes, schema templates, refresh intervals, and lifecycle policies.
- Query API owns RBAC, query planning, cost limits, pagination, and async export.
In the room: Say where durability begins for each log class. For debug it may be local spool or queue ack; for audit it should be a replicated durable queue with clear alerting if unavailable.
Core design approaches
Agent-based collection
Agents give you control near the source. They can batch lines, add host and Kubernetes metadata, apply first-pass size limits, spool to disk, and decide what happens under pressure. Without an agent, applications tend to own logging delivery themselves, which spreads retry and backpressure bugs across every service.
The agent should not block application threads forever. If an app writes to stdout, the runtime and node agent must have bounded buffers. If a service writes through a logging SDK, the SDK should have a small async queue and a policy for overflow.
Durable queue before indexing
A durable queue such as Kafka or Kinesis decouples producers from processors and search indexes. If the hot index slows down, agents and collectors can keep writing for a while, and consumers can catch up later. The queue also enables replay for reindexing after parser bugs or schema changes.
The queue is not infinite. Partition skew, broker disk, retention, and consumer lag still matter. Partition by tenant, service, class, or a composite key so one noisy producer does not block unrelated traffic.
Hot, warm, and cold storage
Hot storage serves recent interactive search. It uses time-based indexes, replicas, and refresh tuning. Warm storage may keep older searchable data with slower disks or fewer replicas. Cold storage keeps compressed files in object storage and supports slower analytics or export jobs.
The user experience should match the tier. Recent incident queries can be fast. Month-old compliance searches may be async and slower.
Schema control and cardinality budgets
Structured logs are valuable when fields are predictable. They are dangerous when every team adds unique fields that become indexed dimensions. The platform should require core fields and limit what can become an indexed field.
High-cardinality fields such as request id, trace id, or user id may be stored for retrieval but not indexed for broad aggregation unless there is a clear product reason. Otherwise, mapping size and memory grow without bound.
Data model
The system stores the same log event in different shapes as it moves through the pipeline.
| Entity or store | Important fields | Why it exists |
|---|---|---|
log_event | event_id, timestamp, tenant_id, service, level, message, trace_id, host, class, schema_version | Canonical event shape after collection |
agent_buffer | local batch id, offset, class, size, retry count | Lets the agent survive short upstream failures |
queue_topic | topic by tenant/service/class, partition, offset | Durable buffer and replay source |
parsed_event | normalized fields, redaction status, parser errors | Safe shape for indexing and routing |
hot_index | time bucket, selected indexed fields, stored message, routing fields | Recent interactive search |
cold_object | date/hour path, tenant, compressed Parquet or JSON, checksum | Long retention and cheaper scan |
retention_policy | tenant, class, hot days, cold days, delete or legal-hold rule | Controls lifecycle and cost |
query_job | user, tenant, query, time range, tier, byte estimate, status | Async cold searches and exports |
Every log should carry a class such as debug, application, audit, security, or access. That class decides sampling, retention, redaction strictness, and drop behavior.
Detailed design
Walk one log line from the application to the on-call search screen. The important design choices are not only the boxes; they are the points where the system buffers, redacts, indexes, drops, or slows down.
Emitting and collecting
An application writes a structured JSON line to stdout or an agent socket. The log includes a timestamp, service name, level, message, trace id, tenant id if applicable, and a class such as debug or audit. The application should not spend unbounded time waiting for the logging system. If it uses a logging SDK, the SDK should enqueue locally and return quickly, with a documented overflow policy.
The node or sidecar agent tails the stream, batches lines, compresses payloads, and writes them to a local disk spool when the collector is slow. The spool has limits because a full node disk can hurt the application. When limits are reached, the agent follows policy: drop or sample debug first, throttle noisy sources if possible, and alert loudly if audit or security logs are at risk.
Ingesting and processing
Regional collectors receive batches from agents and authenticate them. They write to Kafka or Kinesis with enough replication for the log class. A queue acknowledgment is the durability point for important logs. Consumer groups read from the queue, parse structured fields, add environment metadata, redact PII, and route events to the right storage.
Parsing should be strict enough to protect the index. Oversized messages, unknown high-cardinality fields, or invalid JSON can go to a quarantine topic or raw store instead of breaking the hot search schema. Redaction should happen before the hot index because searchable secrets are hard to erase later.
Indexing and retention
Indexers bulk-write parsed events into time-based hot indexes. Bulk writes are more efficient than one write per log line. Index templates control which fields are indexed, which are stored only, and how many shards each time bucket gets. Refresh intervals balance freshness and write cost.
Lifecycle jobs move older data out of the hot tier. Some data may move to warm searchable storage. Older or high-volume data lands in object storage as compressed files. Retention policies delete or hold data by tenant and class. Audit logs may have longer retention and stricter immutability than debug logs.
Querying
A user searches through the query API. The API authenticates the user, checks tenant and service permissions, requires a time range, estimates query cost, and routes the request. Recent bounded searches go to hot indexes. Large or old searches become async jobs over cold storage with progress and download links.
The query engine enforces timeouts, row caps, byte caps, and pagination. If a query is too broad, the API rejects it with guidance rather than letting it scan the world. This is not unfriendly; it is what keeps the platform alive during incidents.
In the room (recap): "Apps emit structured logs to an agent. The agent batches, spools to disk, and applies class-specific overflow policy. Collectors write to a durable queue. Stream processors parse, enrich, redact PII, and route events. Hot indexes serve recent bounded search; object storage holds long retention. Query APIs require time bounds and quotas so one search cannot take down the logging platform."
Architectural dig: backpressure without breaking apps
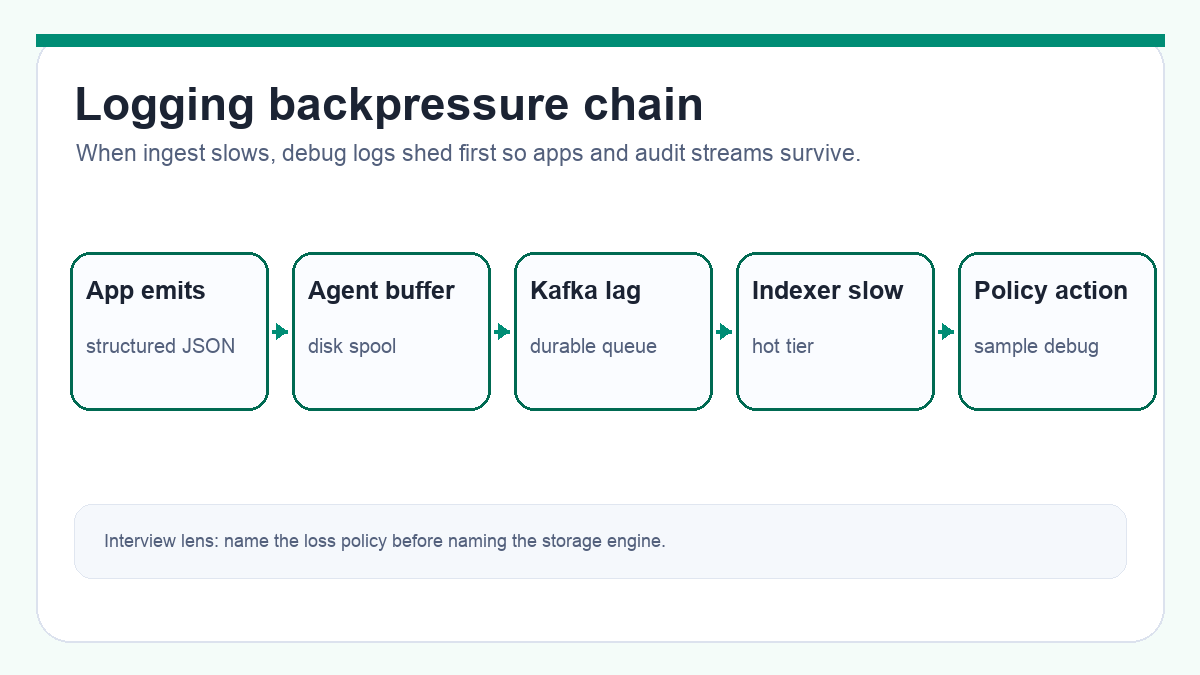
The hardest part of logging is what happens when the pipeline is slow. The wrong answer is "Kafka absorbs it." Kafka absorbs it until partitions lag, broker disks fill, agents run out of spool, and applications start blocking or losing the exact logs needed for the incident.
The tempting but dangerous design
A weak design lets every application send logs directly to the search cluster. When the index slows down, app threads block, retries multiply, and the production incident gets worse. Another weak design drops logs silently when buffers fill. That keeps the app alive but destroys trust in the logging platform.
The better pressure chain
Use agents and a durable queue to create controlled buffers. The agent can absorb short collector failures. Kafka or Kinesis can absorb processor and index slowdowns. Consumer lag tells you how far behind the pipeline is. Each buffer has a size limit, and each limit has a policy.
The policy should be class-specific. Debug logs can be sampled, truncated, or dropped first. Application error logs may be kept longer. Audit logs should use a stronger path and alert rather than silently drop. That policy is a product and compliance decision, not an implementation detail.
The scale inside the box
Partitioning decides who gets hurt during a storm. If all logs share one topic and one partition key, one noisy service can raise lag for everyone. Partition by tenant, service, and log class where useful. Give high-volume tenants quotas or dedicated topics. Keep audit separate from debug so "turning on DEBUG" does not starve security evidence.
The interview land
Land on this sentence: "Logging should protect the application first, but it must make loss visible and class-specific." This shows you understand why a logging outage can both hurt production and hide the evidence needed to fix production.
Key challenges
Backpressure can break the app. If logging writes block request threads or fill node disks, the observability system becomes part of the outage. Agents need bounded buffers and clear overflow policy.
Hot partitions create fake capacity. The cluster can look underused while one tenant, service, or partition is overloaded. Partitioning and quotas are part of reliability.
Cardinality can destroy the index. Indexing request_id, user_id, or arbitrary labels as searchable dimensions can create mapping and memory growth that no amount of disk alone fixes.
PII spreads quickly. Once secrets or personal data enter hot indexes, replicas, snapshots, and exports, cleanup becomes slow. Redact before indexing.
Query abuse is real. A broad wildcard search over a month of logs can cost more than the original incident. Time bounds and cost estimates are safety controls.
Scaling the system
Scale ingestion by adding agents, collectors, queue partitions, and consumer groups. Keep batching large enough to reduce overhead but small enough to avoid long flush delays. Use compression because logs are text-heavy and storage cost dominates over time.
Scale storage by tier. Recent logs use hot indexes with enough shards and replicas for interactive search. Older logs move to warm or cold storage. Cold storage should use partitioned paths by tenant, service, and time so async scans can skip irrelevant data.
Scale query by routing. Hot searches go to time-bounded indexes. Large scans become async jobs with byte estimates. Dashboards and alerts should use precomputed metrics where possible instead of rerunning huge log queries every minute.
Scale multi-tenancy with quotas. Ingest quotas protect queue and index capacity. Query quotas protect search clusters. Retention policies protect cost. Large tenants may need dedicated topics, indexes, or clusters.
Scale schemas with governance. Provide approved fields, reject or quarantine unknown indexed fields, and teach teams to use metrics for high-cardinality aggregation rather than indexing every unique value in logs.
Failure handling
| Failure | What users or teams see | What to build |
|---|---|---|
| Agent cannot reach collector | Local disk spool grows | Retry with backoff, disk limits, class-specific drop policy, and spool alerts |
| Queue lag grows | Logs arrive late in search | Scale consumers, throttle debug, isolate noisy producers, and alert on lag by class |
| Parser bug rejects many logs | Missing fields or quarantine spike | Quarantine topic, parser error dashboards, replay from queue after fix |
| Hot index is red or slow | Search timeouts during incident | Circuit breaker, read-only mode, reduce refresh rate, route old queries away |
| Cold scan is too broad | Huge bill or long-running job | Query estimator, async job limits, approval for large exports |
| Redaction fails | Sensitive data becomes searchable | Block release, quarantine affected stream, rotate secrets, audit access |
The most important distinction is visible delay versus silent loss. A delayed log can still help later. A silently dropped audit line may be a compliance failure.
API design
Most clients interact with the logging system through agent ingest and human search.
| Surface | Role |
|---|---|
POST /v1/ingest/logs | Internal bulk ingest from agents or collectors |
GET /v1/logs | Search recent logs with time bounds and filters |
POST /v1/logs/query-jobs | Start an async cold or large query |
GET /v1/logs/query-jobs/{job_id} | Poll async query status and result location |
POST /v1/logs/live-tail | Start a bounded live tail stream for recent logs |
POST /v1/ingest/logs fields:
| Field | Role |
|---|---|
tenant_id | Tenant or org boundary |
service | Producer service |
class | Debug, app, audit, security, access |
events[] | Batched log events |
agent_id | Source identity for auth and troubleshooting |
GET /v1/logs query params:
| Param | Role |
|---|---|
from, to | Required time range |
service | Filter by service |
level | Filter by severity |
q | Search expression using a safe subset |
limit | Server-capped page size |
cursor | Opaque pagination token |
User query with time range
        |
        v
[ Query API ] -> authz + cost estimate
        |
        +--> recent and bounded --> [ Hot index ]
        |
        +--> old or huge ---------> [ Async cold job ] -> object storage scan
Errors: Return 400 for missing time range or unsupported query, 401 for unauthenticated users, 403 for tenant access denial, 429 for ingest or query quota exceeded, and 413 for oversized ingest batches. For async jobs, return accepted status and progress rather than holding an HTTP request open for minutes.
Observability
The logging platform needs its own observability because it is often debugged during someone else's incident.
Track agent health: bytes read, bytes sent, local spool size, dropped lines by class, retry count, CPU, memory, and disk pressure. Track collector health: request rate, auth failures, batch size, queue write latency, and rejected batches.
Track queue health: producer rate, consumer lag by topic and class, partition skew, broker disk, under-replicated partitions, and replay age. A global lag number hides the fact that audit may be healthy while debug is delayed, or the other way around.
Track processing health: parser error rate, schema quarantine count, PII redaction failures, enrichment latency, and route errors. Track index health: bulk write latency, rejected writes, refresh latency, segment count, merge throttling, disk watermark, and shard p99.
Track query health: query p50/p95/p99, timeout rate, bytes scanned, rows returned, rejected expensive queries, cache hit rate, and top users by cost. Track cost by tenant, service, class, tier, and retention window so teams can see what they generate.
Security and abuse
Logs often contain the data people forgot to protect elsewhere. Redaction should happen before broad indexing. Agents and processors should strip authorization headers, cookies, access tokens, passwords, credit card numbers, and known sensitive fields. If raw logs must be retained, they belong in tighter access storage with stronger audit.
Use RBAC and tenant isolation on the query API. A developer should only see logs for services and tenants they are allowed to access. Security and audit logs may need stricter roles than ordinary app logs.
Protect ingest endpoints. Agents should authenticate with certificates or signed credentials. Reject untrusted producers so attackers cannot flood the platform with fake logs or poison investigations.
Protect query endpoints from abuse. Rate-limit expensive queries, reject unbounded time ranges, restrict leading wildcards and heavy regex, and log who accessed sensitive streams. A logging search tool can become a data-exfiltration tool if access is too broad.
Cost awareness
Logging cost is usually storage plus indexing plus query compute. The cheapest log line is the one not emitted, so teams need feedback about bytes by service and log level.
Use sampling and dynamic log levels for debug logs. Keep error and audit policies separate. Truncate oversized messages and block repeated identical spam when safe. Compression helps, but it does not fix an application logging full request bodies at INFO.
Index only valuable fields. Store raw messages for retrieval, but do not index every key. High-cardinality indexed fields increase memory, disk, merge work, and query cost.
Use lifecycle policies. Hot indexes keep recent days. Warm or cold tiers keep older data with slower query expectations. Object storage with partitioned Parquet is much cheaper for long retention than keeping everything in a search cluster.
Make cost visible. Dashboards by tenant, service, class, and field help teams fix noisy logs before finance or SRE has to chase them.
Production scenes
Scene 1: Logging breaks the app during an incident
A bad deploy starts logging full request payloads at INFO. Agents spool to disk, collectors slow down, and queue lag grows. On some nodes, disk pressure makes applications unstable. The logging system, built to help debug the incident, is now adding to it.
The trap is letting logging have unbounded resources on the same hosts as the app. Infinite local buffering is not safe. Blocking application threads forever is not safe. Dropping everything silently is not safe either.
What to build is a bounded policy. Agents cap disk and memory, sample or drop debug first, alert on drops by class, and provide dynamic log-level controls. Audit streams are isolated or protected so noisy debug does not erase security evidence.
Scene 2: One high-cardinality field melts the hot index
A team adds request_id as an indexed keyword to every log line because it helps one search. Over weeks, mappings grow, heap pressure rises, merges slow, and dashboards time out. The team sees slow search; the platform team sees memory and shard pressure.
The trap is treating every field as free to index. Search engines are fast because they build data structures. Unique values per row make those structures huge.
What to build is schema governance. Required fields are indexed. Some fields are stored but not indexed. High-cardinality fields need approval or special storage. Parser quarantine protects the hot cluster from sudden mapping explosions.
Scene 3: PII appears in logs before anyone notices
A service logs an Authorization header during an error path. The line enters the hot index, replicas, snapshots, and a dashboard. By the time someone notices, the secret has been searchable for hours.
The trap is relying on teams to never log sensitive data. They will make mistakes, especially in error handling and retries.
What to build is layered redaction. SDKs and agents block known secret fields early. Stream processors tokenize or remove PII before indexing. Access to raw quarantine storage is restricted and audited. Redaction failures page the platform team because cleanup after indexing is slow.
Scene 4: A rogue query hurts everyone
During a major outage, many engineers search broad ranges with wildcards. One user queries thirty days across all services, and the hot cluster starts rejecting legitimate incident queries.
The trap is letting the query language be more powerful than the operating budget. A search box without time bounds is a shared-cluster risk.
What to build is a query planner with limits. Require from and to, estimate bytes, cap result rows, reject costly expressions, and move large scans to async cold jobs. This keeps incident search useful for everyone.
Bottlenecks and tradeoffs
Completeness vs application safety
The tension is that teams want every line, but the application must keep running. If logging blocks the app under pressure, observability becomes an outage amplifier.
The practical answer is class-specific policy. Debug can sample or drop. Audit should be isolated and alert on risk. State which logs can be lost and which cannot be silently lost.
Hot search vs retention cost
The tension is that hot indexes make recent search fast but are expensive to keep for months. Object storage is cheap but slower.
Use hot storage for recent incident debugging and cold storage for long retention. The API should make the difference visible instead of pretending every query has the same latency.
Schema flexibility vs index stability
The tension is that teams want to add fields freely, but uncontrolled fields create mapping and cardinality explosions.
Define a core schema, approve indexed fields, store extra fields safely, and quarantine dangerous schema drift.
PII deletion vs append-only audit
The tension is that privacy rules may require deletion while audit systems may require immutability. One storage policy cannot satisfy every class.
Use class-specific retention, redaction before indexing, legal holds where required, and carefully scoped deletion or crypto-shredding when policy demands it.
Interview tips
Do not stop at "ELK"
You might say: "We send all logs to Elasticsearch and use Kibana."
Interview Push: "What happens when ingestion spikes, one field has huge cardinality, or old data becomes too expensive?"
Land here: Explain the full pipeline: agents, local buffers, durable queue, parsing, redaction, hot index, cold archive, query API, and lifecycle policy. The search engine is one component, not the design.
Define the loss policy out loud
You might say: "We do not lose logs."
Interview Push: "The agent disk is full and Kafka lag is two hours. Does the app block? Do audit logs drop?"
Land here: Separate classes. Debug can sample or drop first. Audit uses a stronger path and alerts if threatened. The application should not block forever on logging, but loss must be visible and policy-driven.
Put redaction before indexing
You might say: "We can delete PII later if needed."
Interview Push: "After it has been indexed, replicated, snapshotted, and exported?"
Land here: Redact or tokenize before hot indexing. SDKs and agents block obvious secrets, stream processors enforce policy, and query access is role-based. Cleanup after broad indexing is slow and incomplete.
Bound every query
You might say: "Users can search logs by any keyword."
Interview Push: "Can they search all services for thirty days with a wildcard during an incident?"
Land here: Require time ranges, estimate bytes, cap rows, timeout expensive queries, and route large old scans to async cold jobs. This protects the shared platform.
Talk about logging hurting production
You might say: "If logging is down, we just lose visibility."
Interview Push: "What if agents fill disk or app threads block while writing logs?"
Land here: Logging can break apps. Agents need bounded buffers, local spool limits, backpressure policy, and dynamic log-level controls. Watch dropped lines by class and agent disk usage, not only search cluster CPU.
What should stick
- Follow one log line. App emit, agent buffer, durable queue, parser, redaction, hot index, cold archive, query.
- Class decides policy. Debug, app, audit, and security logs have different sampling, retention, and loss rules.
- Backpressure is the real design. Every buffer needs a limit and a policy for what happens when it fills.
- Hot is expensive. Keep recent data searchable; move old data to cheaper tiers with slower query expectations.
- Redact early and bound queries. Sensitive data and broad scans are easier to prevent than to clean up.
Tell it in the room: "Apps emit structured logs to agents. Agents batch, compress, and spool locally with class-specific overflow policy. Collectors write to Kafka as the durable buffer. Stream processors parse, enrich, redact PII, and route data. Recent logs go to hot time-based indexes; old logs go to object storage. Query APIs enforce RBAC, time bounds, cost limits, and async cold scans. Under pressure, debug can sample first, audit alerts rather than silently disappearing."
Related Topics
- Auth System Design - Audit logs, account events, and sensitive security data.
- Rate Limiter System Design - Query and ingest quotas under shared load.
- Distributed Cache System Design - Hot keys, partitions, and operational blast radius.
- Job Scheduler System Design - Background workers, retries, and dead-letter queues.
- Design WhatsApp - Privacy-aware logging when message content is sensitive.
Frequently asked follow-ups
- How do agents collect and buffer logs?
- Where is the durable point in the pipeline?
- How do you search recent logs quickly?
- How do you control retention and cost?
- What happens when logging breaks applications?
Deep-dive questions and strong answer outlines
How does one log line travel through the system?
The application writes structured output to stdout or an agent socket. The agent batches and spools to disk if upstream is slow. Regional collectors write to Kafka or Kinesis with durability. Stream processors parse, enrich, redact PII, route by tenant and class, and bulk-write recent logs to a hot search index while archiving older or raw data to object storage.
Where is a log considered durable?
For normal debug logs, durability may start when the agent has spooled to disk or when Kafka acknowledges the write, depending on policy. For audit logs, define a stronger point, usually successful write to the durable queue with replication. Say which class can be dropped under pressure and which must alert instead.
How do you stop one service from overwhelming the platform?
Apply quotas by tenant, service, and log class at the agent or collector. Use dynamic log-level controls, sample debug logs first, isolate hot tenants with separate topics or partitions, and alert on bytes per service. Do not let a noisy debug stream share the same fate as audit logs.
How do you keep queries fast?
Require time bounds, route to time-based hot indexes, limit rows and bytes, reject or async-export large cold scans, and control indexed fields. Search recent data in a hot tier; query old data from object storage or a columnar engine with slower expectations.
How do you handle PII in logs?
Redact or tokenize sensitive fields in the stream before indexing. Block known secret fields at the agent when possible, enforce schemas, restrict query access with RBAC, and keep raw logs in tighter storage if they must be retained. Deleting PII after petabytes are indexed is slow and unreliable.
AI feedback on your design
After a practice session, InterviewCrafted summarizes strengths, gaps, and interviewer-style expectations—similar to a written debrief. See a static example report, then practice this problem to get feedback on your own answer.
FAQs
Q: Is ELK enough for the answer?
A: ELK or OpenSearch can be the hot search engine, but the design also needs agents, buffers, parsing, redaction, quotas, retention tiers, query limits, and failure policy.
Q: Should logs be exactly once?
A: Most logging systems accept at-least-once delivery with duplicate-tolerant event ids. Losing audit logs is worse than duplicating a line. Debug logs may accept sampling or loss under pressure if that policy is explicit.
Q: How is logging different from metrics and traces?
A: Logs are detailed events and messages. Metrics are aggregated numbers with low cardinality. Traces connect spans across services. A good platform links them through fields such as trace_id, but it does not store every trace dimension as an indexed log label.
Q: Why not index every field?
A: Every indexed field costs memory, disk, and merge work. High-cardinality fields such as request_id and user_id can explode index size if indexed blindly. Store them, but only index fields that teams really need to filter.
Practice interactively
Open the practice session to use the canvas and stages, then review AI feedback.