System design interview guide
Logging System Design
Incident at 2am: 400 TB/day of logs and grep times out—SREs need tail live and search last 7 days without one Elasticsearch cluster dying from a rogue * query. Ingestion, indexing, and retention tiers are the interview.
Problem statement
Centralized logging: ingest, index, query, retention at petabyte scale.
Introduction
A bad deploy turns on DEBUG for one service. Within an hour the logging bill exceeds last month's total. On-call opens Kibana—and search times out because someone indexed user_id on every line.
Logging platforms lose interviews when candidates treat search as free. Strong answers tier data, bound cardinality, and shed load before Kafka backs up into application processes.
Weak answers stop at "Elasticsearch." Strong answers walk agent → buffer → process → hot index → cold archive and say what happens when a service printf-loops.
If you remember one thing: Logs are a product with SLOs and cost—not an infinite printf sink.
How to approach
Talk like you are following one log line, not naming observability vendors.
- Ask scope — Audit vs debug classes? Multi-tenant? Retention and compliance (GDPR delete vs WORM)?
- Producer → buffer — Agent batching, ack semantics, backpressure to the app.
- Process → index — Enrichment, PII scrub, route by tenant/class.
- Hot vs cold — Days in search index; months–years in object storage.
- Query — Time-bounded API, RBAC, cost caps on large scans.
In the room: "I'll classify log types first, then walk one line from stdout to hot index and say when it ages to cold storage."
If you remember one thing: Define which hop is durable before you draw boxes.
Interview tips
Five common exchanges. Each has a trap answer, a pushback, and where to land.
Stopping at "Elasticsearch"
You: "We send everything to Elasticsearch and search in Kibana."
They ask: "One service logs request_id as a keyword on every line—what happens to heap in six months?"
Land here: Hot tier for recent interactive search with cardinality limits. Route high-cardinality fields to non-indexed storage or columnar cold tier. ILM moves old data to cheap object storage.
Ack semantics
You: "Once the app writes to stdout, the log is safe."
They ask: "The pod dies before the agent ships the line—did you lose the audit event?"
Land here: Agent acks to the app only after durable enqueue in Kafka (acks=all). Define which hop is "safe" for audit class vs debug.
Backpressure under burst
You: "Kafka absorbs any spike—we never drop."
They ask: "Kafka lag hits two hours and agent disks fill—then what?"
Land here: Backpressure to producers: sample or throttle debug at the agent. Never silently drop audit without policy. Dynamic log level on the noisy deployment. Dedicated partitions for noisy tenants.
PII in logs
You: "We'll delete PII later with a batch job."
They ask: "GDPR request while petabytes are indexed—how long does that take?"
Land here: Scrub in stream at ingest—tokenize emails, strip auth headers. RBAC on query API. Retention-only policy vs true delete is a product/legal call—name the tension.
Audit vs debug
You: "We sample 1% of all logs to save cost."
They ask: "Finance needs every admin action for seven years—where did those lines go?"
Land here: Separate streams or classes. No sampling for audit. WORM or append-only store where required. Debug can sample; audit cannot.
If you remember one thing: After each push, name one control—quota, cardinality cap, tier, ack hop—not "we'll scale the cluster."
Capacity estimation
| Dimension | Rough scale | What it means for design |
|---|---|---|
| Aggregate EPS | Millions/sec | Partition Kafka by tenant or service; isolate blast radius |
| Hot index | Days of data | Interactive p95 search—expensive SSD and merges |
| Cold store | Petabytes | Object storage + Parquet—async scan, not sub-second Kibana |
| Query patterns | Ad-hoc vs dashboards | Different cache and timeout strategies |
So we cannot: index every debug field at full cardinality forever. We cannot treat cold-tier scans like hot search without cost estimators and timeouts. We cannot let one tenant fill shared buffers without quotas.
If you remember one thing: Hot = fast and expensive; cold = cheap and slow—APIs must reflect that.
High-level architecture
What breaks if ingest has no guardrails
A loop logs in a tight for. Kafka lag grows. Agent disks fill. The app blocks on backpressure—or OOMs. Audit lines drop silently with debug because everything shared one pipe.
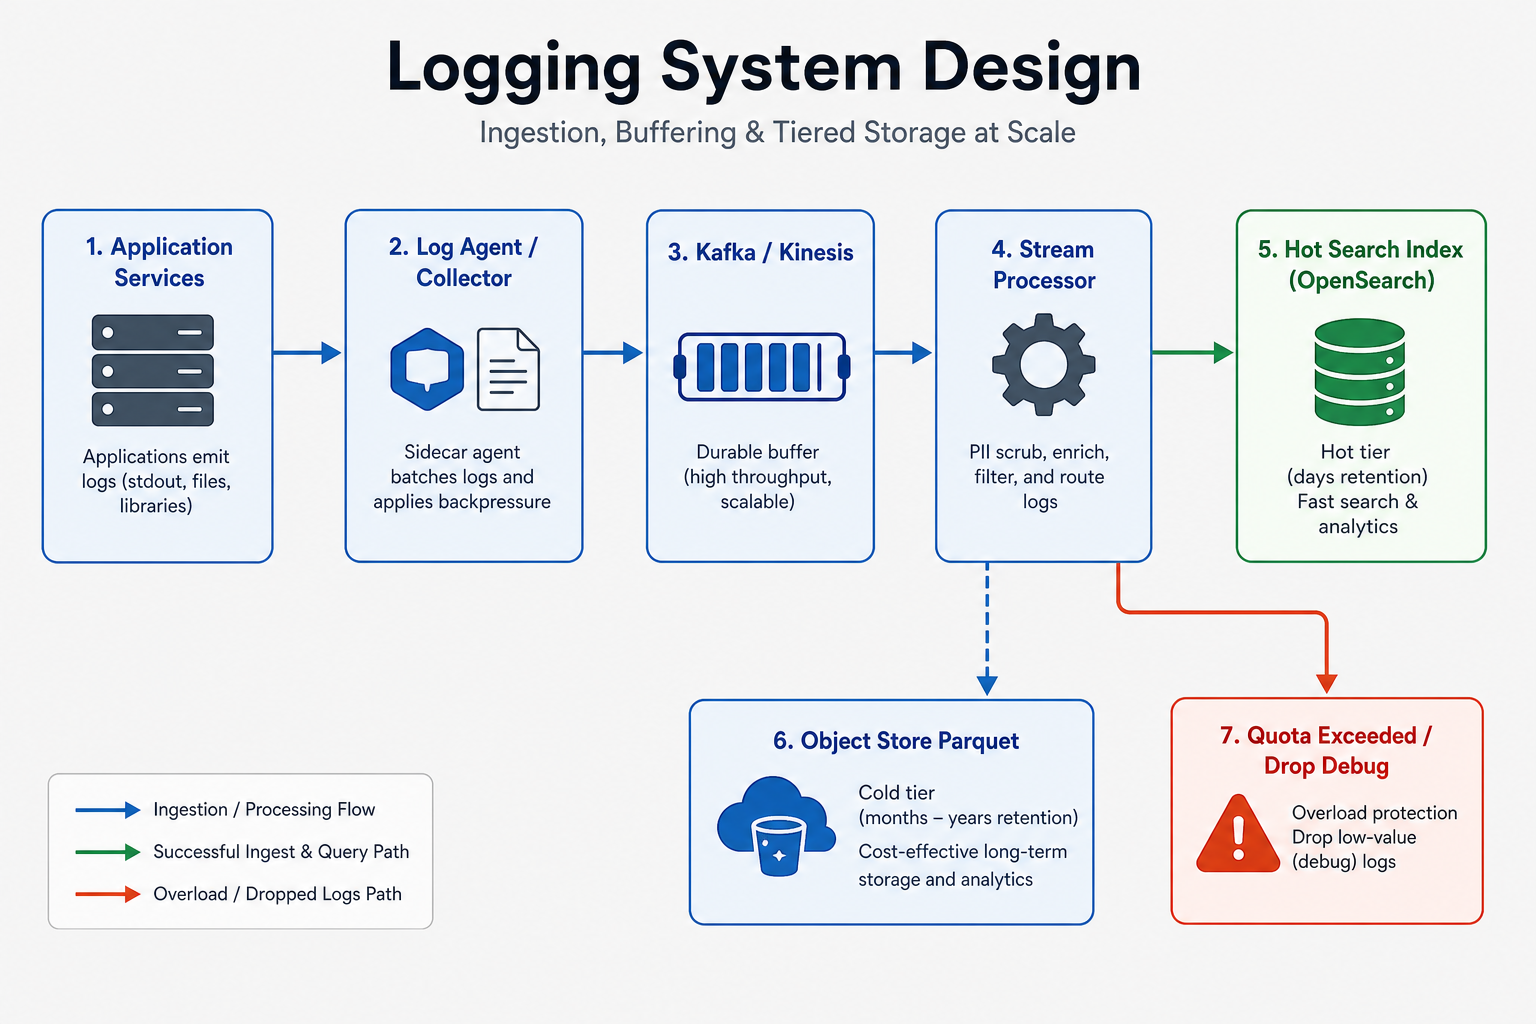
What works: buffer, classify, tier
Agents (Fluent Bit, Vector, etc.) run on nodes or as sidecars. They tail stdout or receive gRPC, batch, compress, and spool to disk if upstream is slow. Regional collectors produce to Kafka / Kinesis. Stream processors enrich (Kubernetes metadata, trace id normalization), mask PII, and route by tenant and log class. Indexers bulk-write to OpenSearch/Elasticsearch hot tier (e.g. 7 days). Lifecycle jobs move to S3 Parquet with Athena/Glue or ClickHouse for analytics.
Who does what:
- Agent — Backpressure to the app; never block app threads forever.
- Kafka — Durable buffer; replay for reindex.
- Indexer — Bulk API; segment merges cost CPU.
- Query API — AuthZ/RBAC; query cost estimate and timeouts.
[ App ] --> stdout / socket --> [ Agent ] --> [ Regional collector ]
                                                  |
                                                  v
                                            [ Kafka / Kinesis ]
                                                  |
                    +-----------------------------+-----------------------------+
                    v                             v                             v
            [ Stream: PII scrub ]           [ Stream: route ]            [ Stream: metrics ]
                    |                             |
                    v                             v
              [ Hot search index ]          [ Object store Parquet ]
              (days, interactive)         (months–years, async query)
In the room: Say explicitly: audit streams may skip sampling and land in WORM or stricter retention.
If you remember one thing: The buffer protects producers; quotas protect the cluster—both are required.
Core design approaches
Structured log model
JSON with required fields: timestamp, service, level, trace_id, message (bounded size). Reject or quarantine oversize lines and schema drift.
If you remember one thing: Unbounded message size and unknown fields are DoS vectors—cap them at ingest.
Hot / warm / cold tiering
Hot: sub-hour query latency for on-call—search index with ILM.
Warm/cold: minutes to hours for compliance or analytics—object storage, columnar engines.
If you remember one thing: Query API should default to hot and require explicit opt-in for expensive cold scans.
Detailed design
Walk one log line from emit to search.
Ingest path
- App writes structured JSON to stdout or agent socket.
- Agent buffers in memory; spools to disk if Kafka is slow; applies tenant quota.
- Produce to Kafka with
acks=all(durability vs latency tradeoff). - Consumer group enriches, scrubs PII, routes to indexers; bulk-write to hot cluster.
If you remember one thing: Audit and debug should diverge before the index— not after everything is mixed.
Query path
- User submits time range plus filters (service, level, text query).
- Planner picks time partitions on hot tier (or triggers async cold export).
- Execute with timeout and row/byte cap; return cursor for pagination.
In the room: "Search without from/to is rejected—unbounded queries burn money."
If you remember one thing: Every query needs time bounds and a cost ceiling.
Key challenges
- Burst after bad deploy — Rate limit per service at agent; dynamic log level down; isolate partition.
- Schema drift — Reject unknown high-cardinality fields or quarantine to raw topic.
- Multi-tenant noisy neighbor — Quota ingest EPS and query cost; separate clusters for prod vs staging.
- GDPR delete vs append-only — Retention TTL vs async compaction; legal hold exceptions.
If you remember one thing: Cardinality and volume are the enemies—not disk size alone.
Scaling the system
- Partition Kafka by service or tenant; dedicated topics for audit.
- Horizontal indexers; frozen indices for old hot segments; ILM to cold.
- Separate clusters for prod vs staging; optional per-tenant dedicated index for whales.
- Regional collectors when data residency requires local ingest before federation.
If you remember one thing: Scale consumers with lag alerts—not only index node count.
Failure handling
| What happens | What operator sees | What to build |
|---|---|---|
| Kafka lag grows | Ingest delay minutes | Scale consumers; throttle debug producers |
| Index cluster red | Search timeouts | Circuit-open query; read-only mode; shed non-critical |
| Agent disk full | Gaps in SIEM during incident | Drop oldest debug buffer first; alert on drop counters |
| Cold scan too large | Five-figure cloud bill | Cost estimator; require async export job |
Real outage = cannot investigate prod (search down). Silent loss = audit gaps—worse for compliance.
If you remember one thing: Alert on dropped lines by class and ingest lag—not only index CPU.
API design
| Surface | Role |
|---|---|
| Ingest (internal) | HTTP/gRPC bulk from agents |
GET /v1/logs | Search with time range and filters |
GET /v1/logs query params:
| Param | Role |
|---|---|
from, to | Unix ms range (required) |
q | Lucene/KQL subset |
limit | Hard cap on rows returned |
cursor | Pagination |
Diagram (query hot path):
User --> Query API --> AuthZ --> Search cluster (hot, time partitions)
                           |
                           +--> async export job --> cold (Parquet) for large scans
Errors: 429 ingest or query quota exceeded; 400 missing time range. RBAC denies cross-tenant reads.
In the room: Walk ingest ack hop, then GET /v1/logs with mandatory from/to.
If you remember one thing: Public query APIs must bound work—time, limit, timeout.
Production angles
Logging platforms fail expensive and fail quiet. GB/day becomes PB/month. Index merges stall search. Agents drop lines before anyone sees a red dashboard.
One service emits half the bytes
What users saw
Cost anomaly flagged one team. Ingest quota tripped and dropped lines for neighbors on a shared pipeline.
On-call found a loop logging full HTTP bodies at INFO.
Why
DEBUG left on via bad defaults. Retry storms amplify volume.
Someone added user_id as an indexed label on every line—cardinality explosion.
What good teams do
Per-service ingest budgets with soft then hard throttle.
Feature flags for dynamic log level per deployment.
Static analysis blocking high-cardinality labels in CI.
Finance and SRE share one cost per service graph.
Indexing p99 spikes nightly—merge storms
What users saw
Search and dashboards slowed at predictable midnight windows.
Ingest lag grew even when write rate looked flat.
Why
Too few shards for volume; massive segments trigger merges.
Cheap disks saturate on merge I/O. Reckless forcemerge makes it worse.
What good teams do
Right-size index templates (shards, replicas, refresh interval).
ILM to frozen tier or object storage. Alert on merge throttling and segment count—not only CPU.
High-cardinality fields indexed
What users saw
Mapping explosion. Heap pressure. Dashboards that used to load now timeout.
Someone indexed trace_id or request_id as a keyword "for flexibility."
Why
Inverted indices do not forgive unique per-row dimensions at scale.
"We will filter later" becomes "we cannot afford this cluster."
What good teams do
Denylist labels in agents. Route high-cardinality fields to non-indexed or columnar stores.
Teach cardinality budgets per team. Separate products for traces vs logs.
Backpressure: Kafka lag while agents buffer—then drop
What users saw
Ingest lag ran hours. Agent disks filled. Gaps appeared in the SIEM during the exact security incident they needed logs for.
Why
Traffic spike or broker issue slowed consumers.
Agents prioritize host survival over lossless shipping unless configured otherwise.
What good teams do
Backpressure to producers—sample debug at source.
Dedicated partitions and consumer groups for audit.
Measure ingest lag, index rate, dropped lines by class, query p95.
[ Log storm ] --> Kafka lag --> consumers fall behind
       --> agents buffer --> disk full --> drop or block producer
How to use this in an interview — Separate debug volume from audit durability in one sentence. Name one failure: cardinality, merge storm, or silent agent drop. Pick one metric (ingest lag, drop counter) and one mitigation (quota, separate stream).
Bottlenecks and tradeoffs
Completeness vs cost
The tension — Engineers want every debug line; finance wants a finite bill.
What breaks — Cluster melt or forced sampling that accidentally includes audit.
What teams do — Explicit sampling for debug only; quotas; dynamic levels.
Say in the interview — "100% debug capture is a policy choice with a price tag."
Search vs analytics storage
The tension — Inverted index excels at keyword needle search; columnar excels at aggregations over PB.
What breaks — Using one engine for both at petabyte scale.
What teams do — Hot OpenSearch for on-call; cold Parquet + Athena/ClickHouse for analytics.
Say in the interview — Match store to query pattern, not vendor habit.
Immutability vs GDPR delete
The tension — Audit wants append-only proof; privacy wants erase.
What breaks — Expensive reindex or legal hold conflicts.
What teams do — Retention TTL by class; crypto-shredding or scoped delete jobs; legal hold overrides.
Say in the interview — Name the tension; do not pretend one index satisfies all compliance modes.
If you remember one thing: Logging tradeoffs are cardinality, tier cost, and audit vs debug—not "which ELK vendor."
What should stick
You do not need to memorize every box. After this guide, you should be able to:
- Backpressure chain — Agent → Kafka → index; shed debug before the app or audit suffers.
- Hot vs cold — Recent logs in search index; old logs cheap in object storage—different query SLAs.
- Cardinality budget — High-cardinality labels destroy index cost; block at agent.
- Audit vs debug — Separate streams; no sampling on audit; WORM where required.
- Ack hop — Durability means Kafka ack, not stdout write.
Tell it in the room: "Apps emit JSON; agents batch to Kafka with acks=all. Stream processors scrub PII and route audit separately. Indexers write hot tier for seven days; ILM rolls to Parquet in S3. Query API requires time bounds and quotas. Under burst, we throttle debug at the agent and never silently drop audit without alerting."
Reference diagram
What interviewers expect
Agents → Kafka → stream consumers → hot warm cold storage; index by time shard.
Interview workflow (template)
- Clarify requirements. Confirm functional scope, users, consistency needs, and which non-functional goals matter most (latency, availability, cost).
- Rough capacity. Estimate QPS, storage, and bandwidth so your data model and partitioning story are grounded.
- APIs and core flows. Define a minimal API and walk 1–2 critical read/write paths end to end.
- Data model and storage. Choose stores for each access pattern; call out hot keys, indexes, and retention.
- Scale and failure. Add caching, sharding, replication, queues, or fan-out as needed; say what breaks in failure modes.
- Tradeoffs. Name alternatives you rejected and why (e.g. strong vs eventual consistency, sync vs async).
Frequently asked follow-ups
- Ingest scale?
- Storage tiers?
- Search?
- vs metrics?
- Alerting?
Deep-dive questions and strong answer outlines
Ingest?
App/agents → local buffer → Kafka partitioned by service → consumers batch write.
Storage?
Hot SSD index recent; warm compressed; cold S3 with Athena; TTL delete.
Search?
Inverted index time-bounded; reject full scan queries; rate limit.
Alerts?
Stream rules or scheduled queries on metrics derived from logs.
Cardinality?
Limit label sets; aggregate metrics separate from raw logs.
AI feedback on your design
After a practice session, InterviewCrafted summarizes strengths, gaps, and interviewer-style expectations—similar to a written debrief. See a static example report, then practice this problem to get feedback on your own answer.
FAQs
Q: ELK enough?
A: Yes as pattern; explain scaling limits.
Q: Logs vs traces?
A: Correlate trace_id in log line—brief.
Q: PII?
A: Scrub at ingest.
Q: Exactly-once?
A: At-least-once + dedupe id ok.
Practice interactively
Open the practice session to use the canvas and stages, then review AI feedback.